You are using an out of date browser. It may not display this or other websites correctly.
You should upgrade or use an alternative browser.
You should upgrade or use an alternative browser.
Virtual Dyno
- Thread starter JoRoW99
- Start date
Also which tire diameter is this thing supposed to use? Actual or theoretical? Doesn't specify and automatically selects theoretical.
This.
By actual, I mean effective. Since we have significant sidewalls, 225/60R16, the deformation makes the effective radius of the tire around 25.71-25.84 (GT lists first size, GTP lists second)
Also curious as to why there is no compensation for torque converter slip.
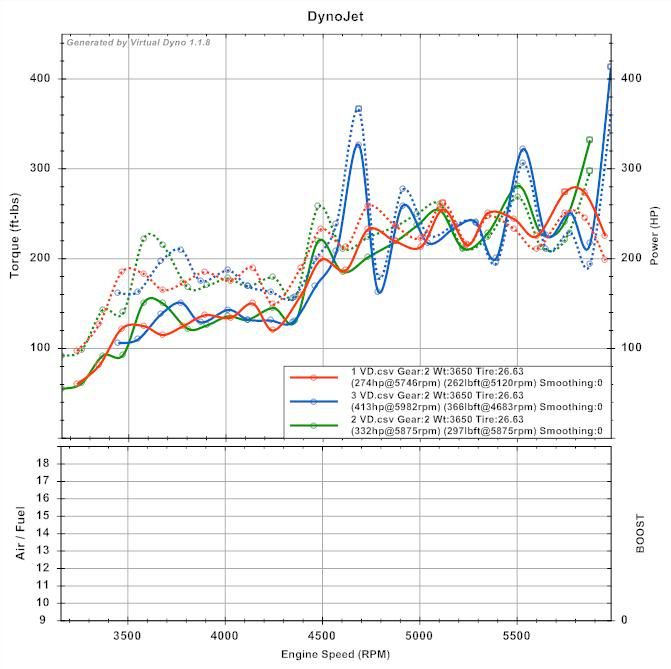
In that red curved I removed the last data point and it jumped back to the next high of ~330 HP. Still nowhere near accurate because of spikes.
The light green pull is the most believable curve however, does it consider air drag? Third gear covers ~84-125 mph. Significant increase in rolling resistance up there. If anything though, it seems to think there is more drag than what was seen by the vehicle.
Based on how sensitive this program is to bad data, I'm not sure it is worth using with our logs as they all seem to be error ridden.
Last edited:
bbarnhill
New member
There is not mathematical way that Im aware of for compensating for a torque converter. It would be complete guessing. Its the same as a slipping clutch how do you guess how much power is being lost there.
Wind resistance is taken into account and added as drag hp. You can check the frontal area and drag coefficient for your vehicle by looking in File -> Car Editor.
Virtual Dyno has been proven to be very accurate on 14 other forums.
Also you arent deforming your tire that much. Not enough to make a difference. These differences are from data in the logs. The issue with tires that you mention is a valid point in dragsters but not in your car.
mechguy
Poppin 'em thangs
Do WOT logs in a gear where the TC is already locked and turn off the A/C to keep the TC locked.
Bad data in, bad results.
Tapadatass
Not sure if this was a joke.
bbarnhill
New member
The part about bad data in bad data out is VERY TRUE!! In the software engineering world we call it Garbage In Garbage Out.
I would like to have a dime for every time that a TC wasnt locked and people were complaining about how VD wasnt accurate because look at this hump ... I am through explaining that to people") They get blank stares from now on because they first need to learn how a car works. (Wow ... that was grumpy of me. I just traded my Evo for a GT500 and drove 400 miles ... Im tired and my gf is 2.5 hours away so Im having PMS.)
They get blank stares from now on because they first need to learn how a car works. (Wow ... that was grumpy of me. I just traded my Evo for a GT500 and drove 400 miles ... Im tired and my gf is 2.5 hours away so Im having PMS.)
I would like to have a dime for every time that a TC wasnt locked and people were complaining about how VD wasnt accurate because look at this hump ... I am through explaining that to people
They get blank stares from now on because they first need to learn how a car works. (Wow ... that was grumpy of me. I just traded my Evo for a GT500 and drove 400 miles ... Im tired and my gf is 2.5 hours away so Im having PMS.)JoRoW99
New member
I think this would be accurate but you have to do probably 5 runs at least to get an average and then compare it to 5 more runs after modifications to see increase. When youre running E85 like me, thats like a whole tank so no bueno. Also matt, why not just go measure your tire diameter? Thats what I did and got around 25.5 or a little more.
bbarnhill
New member
Without a converter being locked you cant get an accurate number because its just flat drive train slippage ... same as a clutch slipping or wheels spinning. As long as you can recognize the parts of the graph that are showing this you can trim it out with the RPM trim bar at the bottom of the run.
This feature should have been used on the blue and green runs above due to the spikes in the tails of the graph.
This feature should have been used on the blue and green runs above due to the spikes in the tails of the graph.